
Ranges of numbers can be generated in two ways by defining the start and end points and whether to generate a fixed number of values, or by defining the interval between each value. These functions generate a vector (series) of equally spaced numbers.
Function definitions:
Rangenum(start, end, number)
Rangeint(start, end, interval)
where
start is the starting value
end is the last value
number is the number of values to be generated
interval is the increment between successive values
Note that in the Rangeint function, if the interval from the last value and the end is not an integer multiple of the interval, then the end value is not included.
Examples:
Using the rangenum function to generate 26 values from 0 to 50
n = 26, start = 0, end = 50
r1 = Rangenum(start, end, n) = {26}
The result {26} indicates that v1 is a vector and that it contains 26 items.
The vector generated from the rangenum function can now be displayed using the vview function.
Function definition:
vview(vector, n, mode)
where
vector is the vector (or table) we wish to view
n is the number of items to display
mode determines the type of display. 0 causes the results to be displayed as a table, 1 as a list
Note that if the second parameter n is greater than the maximum number of items in the vector or table, all of the items will be displayed. So for vector v1 the following list is generated
vview(r1, 26, 1) = 0, 2, 4, 6, 8, 10, 12, 14, 16, 18, 20, 22, 24, 26, 28, 30, 32, 34, 36, 38, 40, 42, 44, 46, 48, 50
Using the rangeint function with an interval of 3.3 and the same start and end points generates another vector containing 16 values
interval = 3.3
r2 = Rangeint(start, end, interval) = {16}
The resulting vector can also be viewed using the vview function
vview(r2, 26, 1) = 0, 3.3, 6.6, 9.9, 13.2, 16.5, 19.8, 23.1, 26.4, 29.7, 33, 36.3, 39.6, 42.9, 46.2, 49.5
We can also generate a range of consecutive integers from 0 to 25 which will be useful to provide an x-axis for plotting results
r3 = Rangeint( 0, 25, 1) = {26}
The three results can now be combined together to form a table using the vtable function
Function definition:
vtable(vector1, vector2)
where
vector1 is the first vector or table
vector2 is the second vector or table
Each vector is combined to form a new column in the table. Note that we can use the vtable function to build up tables containing multiple columns. In the example below we use two vtable commands to combine r3 as the first column (column 0), r1 the second column (column 1) and r2 as the third column (column 2). Note that vectors and tables are indexed using 0 as the first item, 1 as the second and so on.
t1 = vtable(vtable(r3,r1), r2) = {3, 26}
The result {3, 26} indicates that the new table, t1, contains three columns with the maximum number of entries in any column of 26. (Vector r2 only contains 16 values).
As with individual vectors, the table can be viewed using the vview function. Note the use of the final parameter 0 which causes the results to be displayed as a table, rather than a list.
vview(t1, 26, 0) =
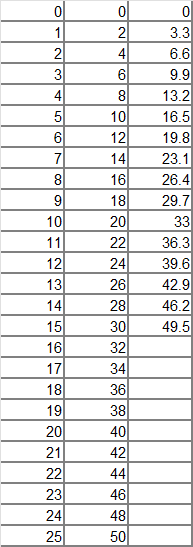
The table is regenerated each time the document is recalculated and formatting which might be applied to the table will be lost when the document is next recalculated.
To reference or extract a vector (column) within a table the [ ] (square bracket) notation can be used. The first column can be referenced as t1[0], the second as t1[1] and the third column as t1[2]. To reference an individual value within a table the [ ] notation can be used twice. For example the third value in the second column of table t1 can be viewed as
t1[1][2] = 4
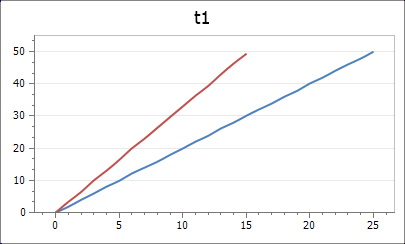
Now that the table t1 has been generated a chart can be generated to show the results with t1[0] as the x-axis and t1[1] and t1[2] as separate traces. Locate the cursor at an appropriate place in the main body of text where the chart is to be created. Right click on the item from which a chart is to be created in the left-hand Variables panel and select ‘Create chart’ to generate a chart or graph.
Creating and editing charts or graphs is explained fully in another document.
The primary purpose of generating ranges of data is to use the vector processing capabilities of SolvePro to generate a range of results. This too is explained in other documents.