Version 8 of SolvePro introduces the facility to perform thousands or even millions of calculations using the same equation (or series of equations) but with different variables. This is achieved through the vector processing facility built into SolvePro. In this context vectors are lists or arrays of numerical values whereas a table is a collection of vectors.
To manage this functionality a number of new ActiveEquation functions have been introduced. Broadly these new functions allow the creation of vectors (i.e. series or arrays) of numbers, process these vectors using a function defined within ActiveEquation and analyse the results. This analysis can also extend to drawing a chart or graph of the variables or results.
A vector is a series of numbers such as {1,2,3,4,5,6}. Vectors can be generated in a variety of ways, automatically using a variety of random number generators, or by defining a range or by entering the data manually. Vectors can also be grouped together to form a table. This makes any analysis and drawing of graphs much easier.
Random number generator functions currently available are:
| Function | Distribution generated |
| Runif | Uniform |
| Rnorm | Normal |
| Rtri | Triangular |
| Rpert | PERT (Program Evaluation and Review Technique) |
| Rmpert | Modified PERT |
Range generator functions currently available are:
| Function | Description |
| Rangenum | Range defined by the number of intervals required |
| Rangeint | Range defined by the size of the interval required |
A vector can be defined manually either as an initial variable or as an inline variable using ActiveEquations. Vector variables are defined using a curly brackets and separating each of the items with a comma. For example, to define a vector v1 containing the numbers, 0, 1, 2, 3, 4, 5, 6, 7 the ActiveEquation command would be v1 = {0,1,2,3,4,5,6,7}
v1 = {0,1,2,3,4,5,6,7} = {8}
The result from this ActiveEquation is {8} The curly brackets are displayed to indicate that it is a vector variable and that it contains 8 entries.
Now that a vector has been defined it is possible to process each of the items individually using a single ActiveEquation. As an example, it may be required to find the cube of each of these numbers. This can be achieved by entering v2 = v1^3 in a new ActiveEquation and by selecting the Use vectors option on the ActiveEquation dialog
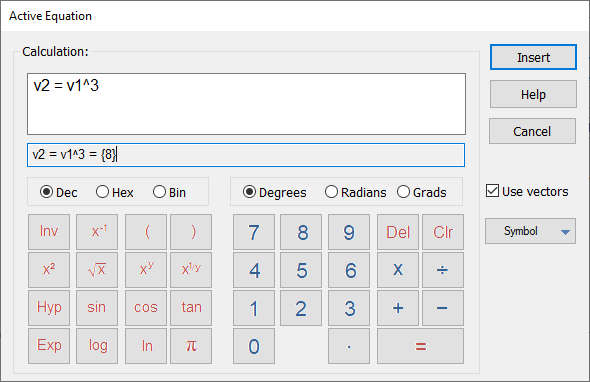
This produces the vector result below
v2 = v1^3 = {8}
Note that a new vector is generated if the Use vectors option is selected so to use that vector in any subsequent calculations it is probably sensible to assign the result as a new variable as done here with v2 being the new variable.
You can use any number of vector variables in a vector calculation. SolvePro will perform the first calculation using the first value from the vectors, the second using the second variable in the vectors etc. For example, using the two vectors defined so far, another equation could now be generated
v3 = v1^2 + 3 * v2 = {8}
In order to view any results, the ActiveEquation function vview (i.e. vector view) can be used e.g.
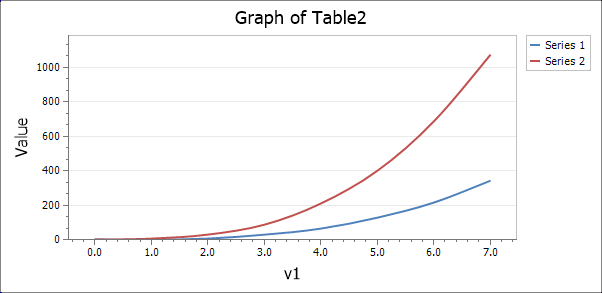
vview(v2, 8, 1) = 0, 1, 8, 27, 64, 125, 216, 343
vview(v3, 10, 1) = 0, 4, 28, 90, 208, 400, 684, 1.08e+03
Some functions generate tables of results directly, such as the Histogram function, however it is possible to combine separate vectors together to create tables manually. This can be achieved using the vtable function (i.e. vector to table). For example,
table1 = {2, 8}
Note now that the result of this command is {2, 8} This signifies that the result is a table containing two vectors where the first vector has 8 entries. Normally the second and subsequent vectors will contain the same number of entries, but this cannot be guaranteed since there is nothing for example to stop you manually appending a {5} vector to a {8} vector.
Multiple vectors can be appended to form a larger table, so that
table2 = {3, 8}
The results of a table can be displayed again using the vview function
vview(table2, 8, 0) =
| 0 | 0 | 0 |
| 1 | 1 | 4 |
| 2 | 8 | 28 |
| 3 | 27 | 90 |
| 4 | 64 | 208 |
| 5 | 125 | 400 |
| 6 | 216 | 684 |
| 7 | 343 | 1.08e+03 |
Note the use of the 0 as the last parameter of the vview function used above. This causes the result to be emitted as a table rather than as a sequence of numbers.
If you try and perform a vector calculation on normal single numerical variables, an error will be generated advising you that no vectors could be found. Conversely if you try and perform a normal non-vector calculation using vector variables, any result will be calculated by using the single numeric value assigned by default to all variables, including vector variables, which is 0.
Vectors can be extracted from tables using the [x] operator and individual values can be extracted from a vector using the same operator. So to extract the first vector from table1 as defined above the command table1[0] can be used i.e.
v4 = {1, 8}
Note that vectors and tables are indexed from 0 with the first item accessed as 0 the second as 1, the third as 2 and so on.
Since table1 was built by appending v2 to v1, the first vector in table1 is a copy of v1 so that v4 is exactly the same as v1 as can be seen below
vview(v4, 10, 1) = 0, 1, 2, 3, 4, 5, 6, 7
The third value (index 2) from v4 can be extracted using the same [x] operator, i.e.
var = 2
It is possible to extract an individual item in a table in one step by combining two [x] operators. So to extract the same value as above, the command table1[0][3] can be used
var = 2
Vectors and tables can also be used as data to generate a graph or chart. Charts are the subject of another document where their use is explained in more detail.